


How to Check CPU Temperature
If your computer feels unusually hot or you’ve noticed a sudden slowdown in performance, it might be time to check your CPU temperature. Overheating can lead to various issues, from system crashes to permanent damage to your hardware. By monitoring your CPU temperature, you can prevent these problems and ensure your computer runs smoothly. This guide will explain why checking your CPU temperature is crucial and provide straightforward steps to check it using various methods. Whether you're a casual user or a serious gamer, this knowledge can help you maintain your computer's longevity and performance.
Monitoring your CPU temperature is akin to checking the oil in your car—something that doesn’t need to be done daily but should be part of regular maintenance. High temperatures can lead to throttling, where your CPU slows down to prevent overheating, which can significantly impact your computing experience. By staying informed about your CPU’s temperature, you can take preventive measures and keep your system running at peak efficiency. This article aims to help you understand the importance of monitoring your CPU temperature and guide you through the process with simple, accessible tools.
Let's dive into the world of CPU temperature monitoring and learn how to keep your computer's core components cool and running efficiently. Whether you're experiencing performance issues, planning upgrades, or simply curious about your machine's health, this guide will equip you with the knowledge and tools you need to check your CPU's temperature and take appropriate action if necessary.
- Why Check Your CPU Temperature?
- How to Check CPU Temperature in Windows
- Download and Install Software Tools
- Using NZXT's CAM
- Using Core Temp
- Using AIDA64
- Using HWiINFO
- Using HWMonitor
- How to Check CPU Temperature in macOS
- How to Check CPU Temperature on Android
- Safe CPU Temperatures for Different CPUs
- How to Fix High CPU Temperatures
- Conclusion
Why Check Your CPU Temperature?

Before we dive into how to check your CPU temperature, it's important to understand why this is crucial. Your CPU, or Central Processing Unit, is the brain of your computer. It handles all the computational tasks, from running applications to executing complex calculations. The more work your CPU does, the more heat it generates. If this heat isn't managed properly, it can lead to serious issues, from short-term performance drops to long-term hardware damage. By regularly checking your CPU temperature, you can ensure your system is running within safe parameters and take action if it's getting too hot.
How to Check CPU Temperature in Windows

When it comes to monitoring your CPU temperature, there are several software tools available that make the process straightforward. Below, we explore popular options and how to use them.
For more tips on maintaining computer performance, check out How to Make Your Computer Faster.
Download and Install Software Tools
Software Tools:
- NZXT's CAM: A comprehensive tool that not only monitors your CPU temperature but also provides data on CPU load, clock speed, and fan speed. Download NZXT CAM
- Core Temp: A lightweight utility that displays real-time temperatures for each CPU core. It also keeps track of minimum and maximum temperatures. Download Core Temp
- AIDA64: An all-in-one system information and diagnostic tool that includes a powerful stress test feature to check your system's stability under load. Download AIDA64
- HWiINFO: A more advanced tool that provides detailed system information, including CPU temperature, fan speeds, and power consumption. Download HWiINFO
- HWMonitor: A simple yet effective tool that monitors both hardware sensors and system information. Download HWMonitor
For optimal performance, ensure your drivers are up to date. You can learn how to do this by visiting How to Update Nvidia Drivers on Your PC.
Using NZXT's CAM
- Download and Install NZXT's CAM: Visit the official NZXT website to download the software. Follow the installation prompts to install CAM on your computer.
- Launch CAM: Open the application and allow it to scan your system. It will automatically detect your hardware components.
- View CPU Temperature: The main interface displays CPU load, temperature, and clock speed in real-time. You can easily monitor these metrics while your computer is in use.
- Real-Time Monitoring: To check your CPU temperature during gaming or other demanding tasks, use the overlay feature in CAM. This allows you to see the temperature and other metrics in real-time without leaving your game or application.
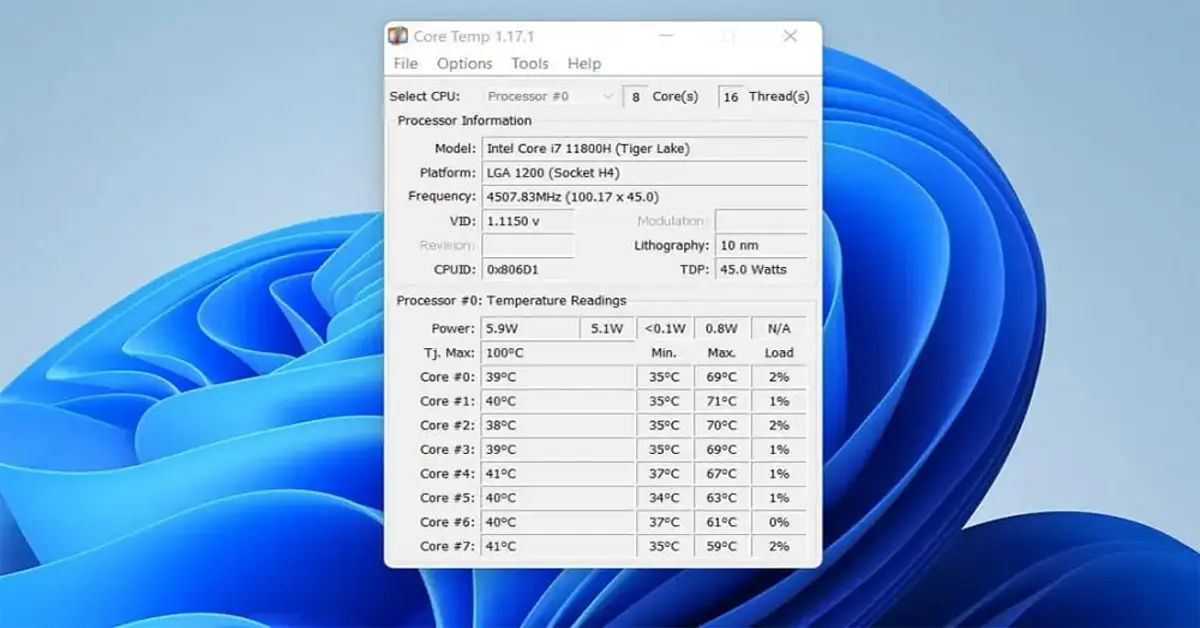
Using Core Temp
- Download and Install Core Temp: Visit the Core Temp website to download the software. Install it by following the on-screen prompts.
- Launch Core Temp: Once installed, open the application. You should see the temperature readings and other relevant data.
- Interpret the Data: Core Temp displays the temperature for each core of your CPU, along ```markdown
Using AIDA64
- Download and Install AIDA64: Go to the AIDA64 website and download the software. Follow the installation instructions to set it up on your computer.
- Launch AIDA64: Open the application. It may take a moment to gather system information.
- Navigate to the Sensor Panel: Click on the "Sensors" option in the left sidebar. This will display a comprehensive list of all monitored parameters, including CPU temperature.
- Monitor Under Load: AIDA64 allows you to run stress tests. You can initiate a stress test to see how your CPU temperature responds under heavy load, which is useful for identifying cooling issues.
Using HWiINFO
- Download and Install HWiINFO: Visit the HWiINFO website to download the software. Install it by following the prompts.
- Launch HWiINFO: Open the application. You can choose to run it in "Sensors-only" mode for a more focused view.
- View CPU Temperature: The sensor panel will show real-time temperature readings for each CPU core, along with other vital statistics like fan speeds and voltages.
- Logging Data: HWiINFO allows you to log temperature data over time, which can be useful for tracking performance and identifying trends.
Using HWMonitor
- Download and Install HWMonitor: Go to the CPUID website and download HWMonitor. Install it by following the instructions.
- Launch HWMonitor: Open the application to view a list of all hardware components and their temperatures.
- Check CPU Temperature: Locate your CPU in the list. HWMonitor displays the current temperature, as well as minimum and maximum values since the program was launched.
- Monitor During Use: Keep HWMonitor running while you use your computer to see how temperatures fluctuate during different tasks.
How to Check CPU Temperature in macOS

If you're using a Mac, checking your CPU temperature is slightly different but equally important. Here are some tools you can use:
Download and Install Software Tools for macOS
Software Tools: - iStat Menus: A powerful system monitoring tool that provides detailed information about your CPU temperature, among other metrics. Download iStat Menus - Intel Power Gadget: A free tool from Intel that provides real-time CPU temperature readings and power usage. Download Intel Power Gadget - Mac Fan Control: This tool allows you to monitor temperatures and control fan speeds. Download Mac Fan Control
Using iStat Menus
- Download and Install iStat Menus: Visit the Bjango website to download the software. Follow the installation prompts.
- Launch iStat Menus: Open the application and navigate to the "Sensors" tab.
- View CPU Temperature: You will see real-time temperature readings for each CPU core, along with other system metrics.
- Set Alerts: iStat Menus allows you to set temperature alerts, so you can be notified if your CPU exceeds a certain threshold.
Using Intel Power Gadget
- Download and Install Intel Power Gadget: Go to the Intel website and download the tool. Install it by following the instructions.
- Launch Intel Power Gadget: Open the application to view real-time CPU temperature and power usage.
- Monitor During Use: Keep the tool running while you perform tasks to see how your CPU temperature changes under load.
How to Check CPU Temperature on Android

Monitoring CPU temperature on Android devices is essential, especially if you notice overheating or battery drain issues. Unlike Windows and macOS, Android does not have built-in tools to check CPU temperature, but several third-party apps can help:
Download and Install CPU Monitoring Apps
Recommended Apps:
- CPU-Z: A lightweight app that provides detailed information about your device’s CPU temperature, load, and battery health. Download CPU-Z
- AIDA64: Offers a complete system overview, including CPU temperature readings. Download AIDA64
- CPU Monitor - temperature: Designed to monitor temperature and cool down your phone by optimizing background processes. Download CPU Monitor - temperature
Using CPU-Z
- Download and Install CPU-Z: Visit the Google Play Store and install CPU-Z.
- Launch the App: Open CPU-Z and navigate to the “Thermal” tab.
- Check CPU Temperature: The app will display real-time CPU temperature, battery temperature, and other hardware details.
- Monitor Performance: Keep the app running while using resource-heavy apps to see how temperature fluctuates.
If your Android device is running hot, consider closing background apps, avoiding direct sunlight, and reducing screen brightness to manage temperature more effectively.
Safe CPU Temperatures for Different CPUs

Understanding what constitutes a safe temperature for your CPU is crucial. Here’s a general guideline:
- Idle Temperature: Ideally, your CPU should be under 50°C when idle.
- Load Temperature: Under load, temperatures should ideally stay below 80°C. Some CPUs, like the AMD Ryzen 5000 series, can operate safely up to 95°C.
- Critical Temperature: Exceeding 95°C can lead to throttling or system shutdowns. Always check the specific TJ Max (maximum junction temperature) for your CPU model to ensure safe operation.
How to Fix High CPU Temperatures
If you find that your CPU temperatures are consistently high, here are some steps you can take to address the issue:
- Check Cooling: Ensure that your computer is clean and free of dust. Dust buildup can obstruct airflow and cause overheating. Regularly clean your fans and heatsinks.
- Thermal Paste: If your CPU is several years old, consider reapplying thermal paste between the CPU and heatsink. Over time, the paste can degrade, leading to poor heat transfer.
- Improve Airflow: Make sure your computer case has adequate airflow. Consider adding more fans or upgrading to a better CPU cooler.
- Reduce Overclocking: If you’ve overclocked your CPU, consider reverting to default settings. Overclocking can significantly increase heat output.
- Check Background Processes: High CPU temperatures can be caused by demanding applications running in the background. Monitor your system for resource-intensive tasks.
- Update Drivers: Ensure that your chipset and graphics drivers are up to date. Outdated drivers can sometimes cause high CPU usage and temperatures.
- Check for Malware: Malicious software can sometimes cause your CPU to work harder than usual. Run a malware scan to rule out this possibility.
By following these steps, you can address high CPU temperatures and ensure your system runs optimally.
Conclusion
Checking your CPU temperature is a simple yet effective way to maintain your computer's health and performance. By monitoring your CPU temperature regularly, you can identify potential issues before they escalate, ensuring your system runs smoothly and efficiently. Whether you're a casual user or a power user, understanding how to check your CPU temperature is a valuable skill that can help you get the most out of your computer. With the right tools and knowledge, you can keep your CPU cool and your system running at its best.